Getting started with Google Data Studio: How to take your Google Analytics reports on the next level8/29/2019 Having the correct user actions tracked is one thing but visualizing it in a way for it to answer questions is a completely different thing. And usually very few companies get to this level and always struggle to get insights which are so much easier to spot with the correct visualizations. There are many tools that let you visualize your data but Google Data Studio is one of the best as it easily integrates with all Google products (and lots more) and has a user friendly interface which makes it creating dashboards and visualizations really easy. To start creating visualizations in Data Studio you first need to link a data source with it. You do this by logging it to Data Studio, clicking on ‘Create’ button and then selecting ‘Data Source’. 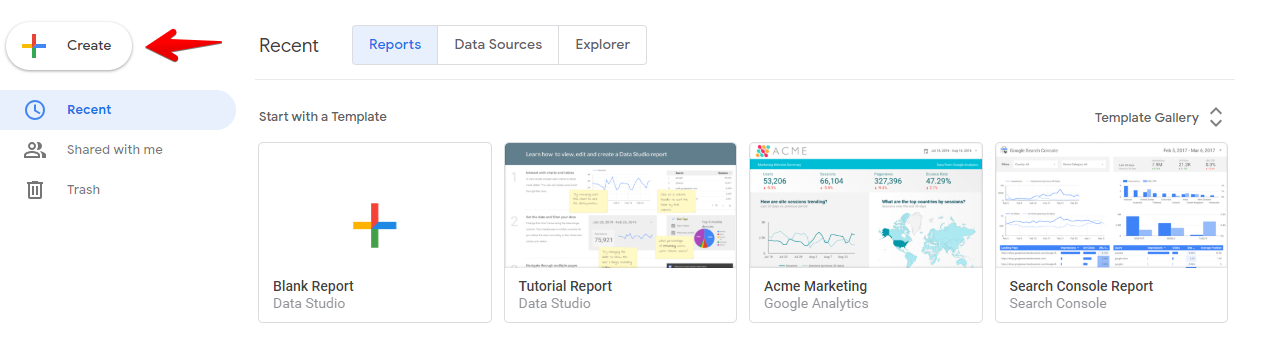 After this, on the next screen you need to select which type of data source you will use. In our example we will use Google Analytics as the data source so we select it. 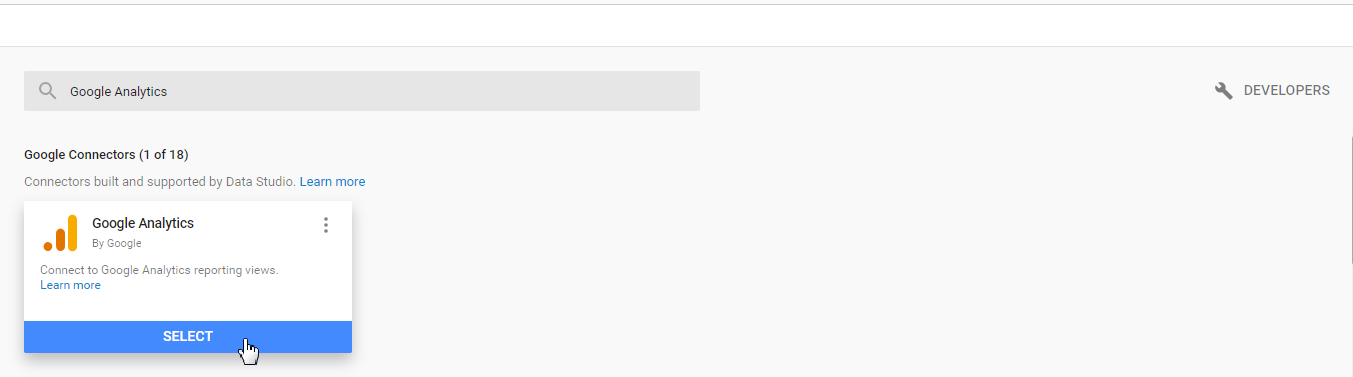 After you have linked a data source, you can start creating a report. You do this by going back to the main page and clicking on ‘Create’ button and selecting ‘Report’. A new blank report will appear and from the right menu, you will have to select the data source which we created in the previous step. Or if you want, you can create a new data source from there. With the data sources added to the report, we can now start creating charts. For this we need to click on ‘Add a chart’ drop-down in the toolbar and select an option that suits the data we want to visualize: 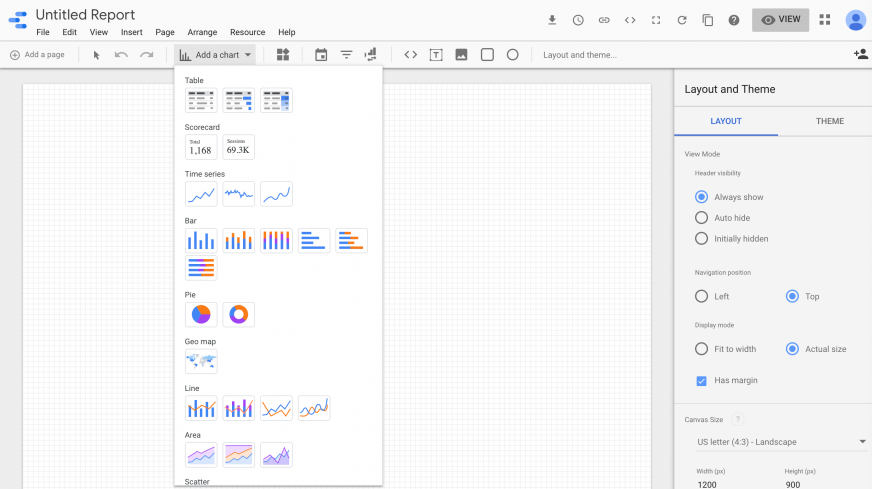 After we have added the chart, we can customize it using the options in from the right sidebar. We can also use the drag and drop functionality if we may wish so. 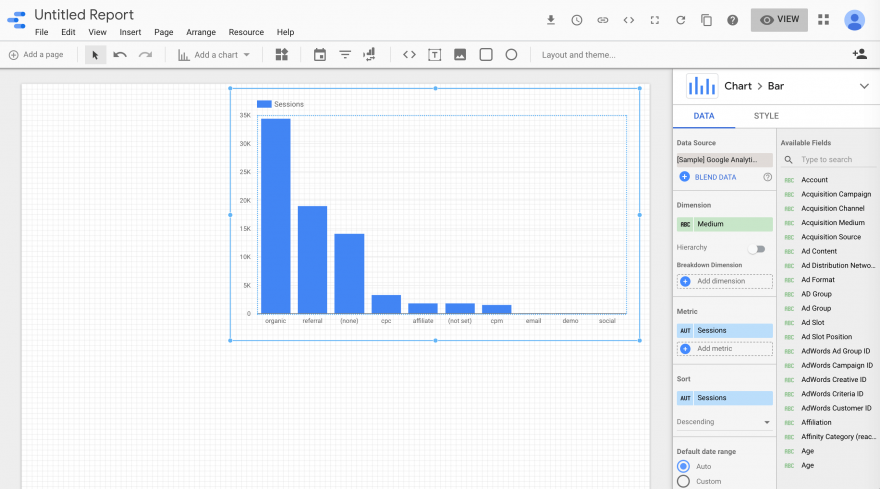 We can further customize the report using the Layout and Theme settings. They’re available in a sidebar that will appear to the right of the editor when we click on Layout and theme from the toolbar. Google Data Studio also has an interesting feature which updates reports automatically, as soon as the data source updates itself. So, once you have created a report to display a certain set of information, you won’t have to continually create new ones as the data changes. Simply make sure your data sources stay current. Now that you have created your visualizations and reports, you can draw some conclusions and share the report with your clients. You can write conclusions right inside the report itself, by using the text chart. And to share it, you just need to click on the ‘Share’ button from the top menu of your report and enter your client’s email address. After sharing the report with your client, he can view it on the web or download is as a PDF using the buttons from the top menu. And this is how to start creating dashboards and reports with Google Data Studio. If you have any questions, feel free to post them using the comment form below.
2 Comments
Event tracking is one of the most popular form of user interaction tracking so learning how to set it up correctly is really important. So in this post we will try to see how to install event tracking for Google Analytics and Yandex Metrica based on a Wordpress site (but it will also work for other CMS). Installing the default pageview script In order to add event tracking on a site, you need to have the regular library offered by these services firing on your site. And for this, you need to create an account with Google Analytics and Yandex Metrica then from your account settings, you need to copy the tracking script and add it on your site. The best way to add the tracking codes on your Wordpress site is by using a plugin like “Insert Headers and Footers” by WPBeginner which allows you to add any code in the header or the footer of all your site pages. So after you have installed the above plugin and registered for an account on the two web tracking services, you need to log in to your Wordpress dashboard, then go to Settings / “Insert Headers and Footers” and paste the tracking code from Google Analytics and Yandex Metrica. 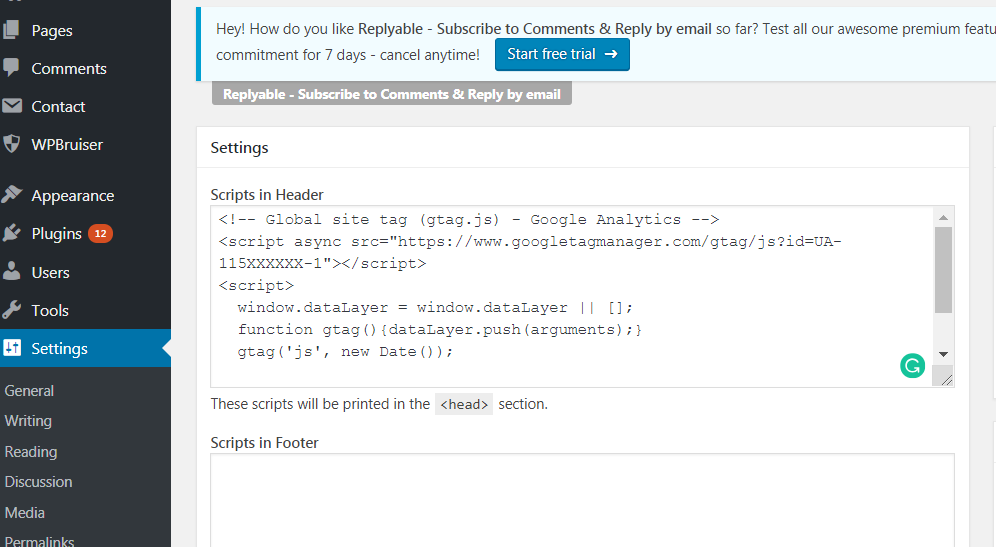 After you have saved the above changes, the default pageview tracking for both Google Analytics and Yandex Metrica should be installed on your site. Adding the event tracking on the site Now that we have the basic pageview firing and the library loaded, we can start adding the event tracking on the site. For Google Analytics events, events are sent using the gtag function with the format being: gtag('event', <action>, { 'event_category': <category>, 'event_label': <label>, 'value': <value> }); In the above script, action - defines the target action (click, submit), label - label / label of the event and category is its category. In the value field we need to add a positive integer and it shows what value we assign to this particular user action. This field is optional. For example, we may use the following code to send events to Google Analytics: gtag('event', 'click', { 'event_category': 'tel', 'event_label': 'header'}); For Yandex Metrica, the same operational principle applies, with just a different function name. ym(XXXXXX, 'reachGoal', target[, params[, callback[, ctx]]]); To add the event tracking to some links, we need to attach our javascript functions to the “onclick” event handler of the A tag element. So to attach the event tracking to a phone umber link, we need to add the following code: <a onclick="gtag('event', 'click', {'event_category': 'tel',’event_action’:’click’}); yaCounter555555. reachGoal( 'telclick' );" href="tel:+380676767667">Tel: +38(067)676-7667 </a> And when a user will click on this phone number link, the gtag() and yaCounter555555() functions will be called which will send the data to Google Analytics and Yandex Metrica. If we want to track a form via events, then we can fire the scripts using the onsubmit event handler which we can attach to the form we need tracked. In the below example, we can see how to attach the events listeners to a form using the onsubmit event handler. <form id="myform" onsubmit="gtag('event', 'sendemail', {'event_category':'mail', 'event_action': 'send', });return true;"> Configuring the goals in Google Analytics After we have installed the event tracking on the site, we need to create a goal for these particular events, so that we would see which traffic sources or which campaigns are generating the conversions. For this, in Google Analytics we need to go to the view where we want to create the goals and select Goals. In the new window that appeared we need to click on “New Goal” and select custom goal from the list and give our goal a name, like “Phone number click”. Then from the type we select event and click next and in the window that appeared, in the event category we write ‘tel’ and click save. 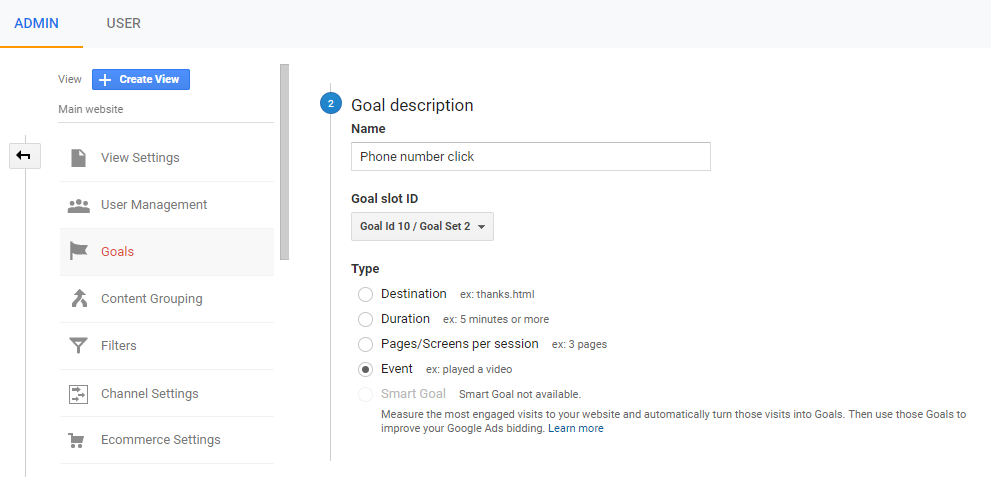 And that’s it. This is how to install event tracking on the site and measure it as a goal in Google Analytics and Yandex Metrica.
|
About MeI am Tracey Bates - a web analyst with more than 10 years of experience and through this blog, I try to share my knowledge with the world. 
ArchivesCategories |
 RSS Feed
